
Chapter 1
Introduction
Cepstrum is a term coined by Bogert, Healy, and Tukey from observations of signals containing echoes and unique properties of the logarithm of its power spectrum [1]. This term, which consists of reversing the letters spec- in the word spectrum, was created because “we find ourselves operating on the frequency side in ways customary on the time side and vice versa” [1]. Initially used for observing seismic signals, cepstrum analysis has been extended to many different applications for sound, such as voiced speech pitch determination [2] and blind deconvolution of old acoustic recordings [3]. Arfib, Keiler, and Zölzer have shown that cepstrum techniques can be used to “separate this curve into its slow varying part (the spectral envelope) and its quickly varying part (the source signal),” which can be used to separate source and filter from a convolved signal [4]. The following paper presents and discusses the topic of creating source filter models with sounds using cepstrum techniques.
The primary motivation of this paper is to gain an in depth understanding of source filter models and cepstrum techniques. Both are ubiquitous in digital sound synthesis and audio processing and will allow the author an excellent understanding and appreciation for the course materials.
Chapter 2 presents some theoretical background information regarding cepstrum analysis. Chapter 3 presents some work in implementing the topic, done by repeating some of the work presented in research on the subject. Chapter 4 discusses the results obtained and the experience of implementing the topic.
Chapter 2
Background Information
This chapter presents theoretical background information on cepstrum analysis
and source filter models.
2.1 Cepstrum Analysis
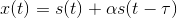
Bogert et al. were observing seismic signals containing echoes when they first developed the term cepstrum in 1963 [1]. We can express a signal with echo in the time domain as follows [5]:
Whose Fourier Transform is then:

The Fourier spectral density of this signal can then be determined to be [5]:

This shows that the spectrum of the original signal modulates a periodic function of frequency caused by the echo. Taking the logarithm of the equation above gives us [5]:

The equation above can be viewed as a waveform that has periodic components at the time delay τ [5]. This is what Bogart et al. described as the cepstrum. The periodic components from the cepstrum can then be used to determine the arrival time of the echo. Later work by Oppenheim and Schafer defined the complex and real cepstrum and equation 2.4 became known as the power cepstrum [6].
In order to define the complex cepstrum, we consider the Fast Fourier Transform (FFT) X(f) of a windowed frame of a signal x[n]:
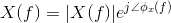
The logarithm of equation 2.5 yields the cepstrum [4]:

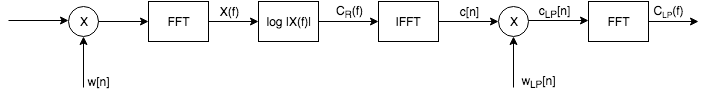
The Inverse Fast Fourier Transform (IFFT) of the above yields the complex cepstrum. The real cepstrum is the IFFT of the real part of the above equation. From the real cepstrum, a smoothed version of the spectral envelope of the original signal x[n] can be determined which can be seen in the diagram below [4].
These cepstrum analysis techniques will allow us to separate the source and the filter, whose significance is described in the following section.
2.2 Source Filter Separation
Source filter separation allows you to remove the harmonic components of a signal (source signal) from the spectral envelope of the signal (filter response) [4]. This is useful for sound signals like voiced vowels, where the vocal tract produces a harmonic signal on which a spectral envelope – caused by the resonator system of the mouth and nose – is superimposed on the excitation [4]. With this separation we can perform some transformations and synthesis that allow the signal to be reconstructed [4].
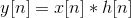
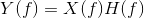
To see how cepstrum analysis is used to separate source and filter, let us first start with a signal y[n] that is the output of a LTI filter h[n]:
We know from the properties of the Fourier Transform that this is a multiplication in the frequency domain:
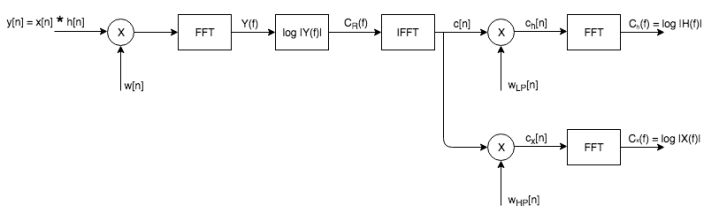
From the cepstrum techniques outlined in 2.1, we know that the real cepstrum cR[n] of this signal is the IFFT of the following:

Separating the source and filter is “achieved by weighting the real cepstrum c[n] = cx[n] + ch[n] with two window functions, namely the ‘lowpass window’ wLP[n] and it’s complementary ‘highpass window’ wHP[n]” [4]. The following block diagram illustrates the separation method:
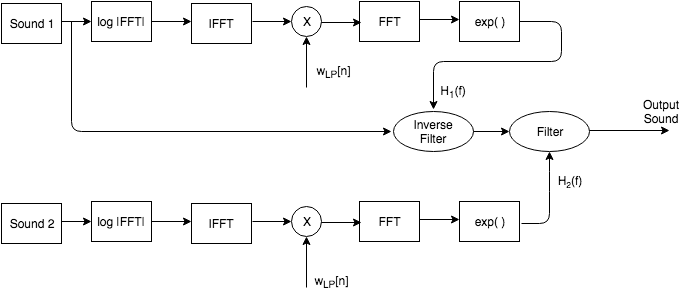
Using this source filter separation, a technique known as homomorphic cross synthesis can be used to reshape a source sound by imposing a different spectral envelope on it [4]. This is done by whitening the first sound, filtering it with the inverse spectral envelope, and then filtering it with the spectral envelope of a second sound [4]. As we’ve seen previously, cepstral techniques can be used to determine the spectral envelopes for a windowed frame of a signal and are therefore a good tool in this type of synthesis. Using Short-Time Fourier Transforms and Overlap-Add, you can generate the cross-synthesized sound in its entirety. The basic block diagram for each frame using this technique can be seen in the image below:
Chapter 3
Results
The following chapter presents some of the work involved in reproducing a selection of current research on the topic.
3.1 Confirming the math
The first step taken in exploring cepstral techniques was to verify that the math seen in Chapter 2 works as described in the literature. Arfib et al. had a figure in [4] that showed the graph of the signals at various stages of the block diagram seen in Figure 2.1. A script was written in MATLAB to replicate the graphs seen in [4]. The exact sound file could not be found, but a similar sound file with a sung vowel “la” (solfege-la.wav) was found on the Freesound database. A MATLAB script takes in the sound file solfege-la.wav and creates plots of the windowed signal x[n], the spectrum X(f), the real cepstrum c[n], the windowed cepstrum cLP[n], and the spectrum X(f) with the spectral envelope CLP(f) superimposed.

This compares nicely with the similar plot in [4]. Using the block diagram in figure 2.1 allows you to process a signal using cepstrum techniques and have an output that follows the spectral envelope of a given signal x[n]. This estimation of the spectral envelope has the same harmonics of the original spectrum of x[n], without any of the spurious changes between harmonics. With this we can separate the source signal and filter.
3.2 Implementing Source-Filter Separation
After confirming that cepstrum techniques yield an estimation of the spectral envelope of an input in Figure 3.1, another graphic was generated to confirm that the cepstrum techniques can be used to separate a source and filter. A MATLAB script was written to verify that the outputs of the block diagram in figure 2.2 are actually the original signal and the spectral envelope of the filter. Again, the sound file solfege-la.wav was used. If the signal is filtered through a Butterworth 4th-order lowpass filter and then cepstrum analysis is performed, according to [4], this should yield a signal Ch(f) that is the spectral envelope of the convolved signal and a signal Cx(f) that is the spectral envelope of the original signal x[n]. The original spectra and the spectra yielded after the cepstrum analysis are shown in the following figure:
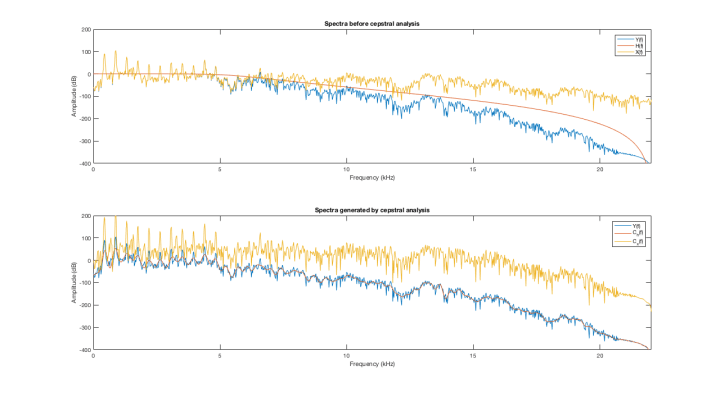
As can be seen from the above figure, source filter separation is possible using cepstrum analysis. The outputs are approximations of the spectral envelope of the convolved signal and the original signal. This property can then be used to perform homomorphic cross-synthesis as described in 2.2.
3.3 Cross-synthesis
The analyses mentioned in the previous sections were quite useful in developing a better understanding of cepstrum analysis. The next step was to apply this knowledge of cepstrum analysis to more musical applications. As mentioned in Chapter 2, an application that uses the spectral approximations that cepstrum analysis gives us is homomorphic cross-synthesis. In order to determine the functionality of the cross-synthesis, a known correct output was required. Fortunately, Julius O. Smith had a collection of sample sounds and the output of their cross-synthesis in one of his course notes [7]. The course notes have a voice “modulator” sound file, of a man saying “We were away a while ago”. This sound file is then cross-synthesized with various sounds, including a recording of a cow, a gong, an airplane, and a creaking ship’s mast. A MATLAB script was written to take in the sound files from [7] and create a cross synthesized output using the algorithm described in [4]. The source sounds and output sounds are included in the .zip file directory containing this report.
3.4 Cross-Synthesis using MAX
The MATLAB script that performs the homomorphic cross synthesis is good as a proof of concept for the algorithm by Arfib et al. [4], but is restrictive. Only a subset of sounds can be modulated using this method without a complete overhaul of the script’s code, reducing tunability and extensibility. The script is also not real time and only creates fixed sound files. MAX however can be used to perform the same sort of synthesis and provide GUI elements that anyone can use to create the cross-synthesis real time. Therefore a MAX patch was designed to perform the same sort of cross-synthesis. MAX is also well suited to this as the pfft~ object manages the initial windowing, overlapping, and adding on its own. The following figures shows the main patch and its pfft~ sub-patch.
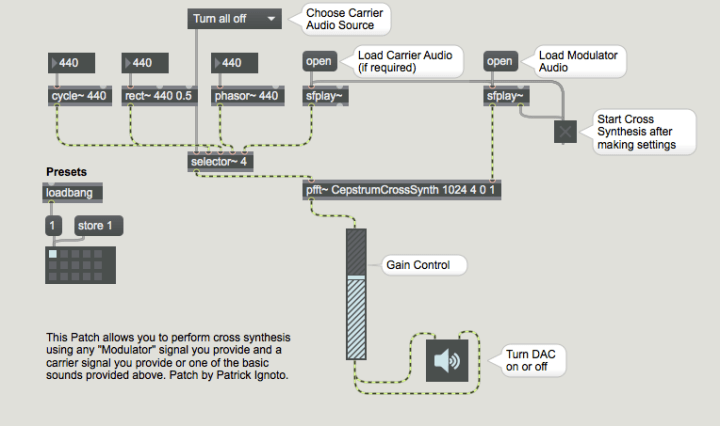 Figure 3.3: Main MAX patch for cross-synthesis
 Figure 3.4: pfft~ sub-patch that does cross-synthesis using cepstrum techniques
As well as loading your own sound, you can use one of the pre-defined waveforms in MAX (cycle~, rect~, and phasor~) as the carrier signal to modulate.
Chapter 4
Discussion
The following chapter discusses the results obtained from chapter 3 and the experience of implementing the topic.
4.1 Implementation issues
A major point of confusion in implementing this topic was the cepstrum weighting low-pass filter. In the paper by Arfib et al. [4], they initially quote a low-pass filter that they cite was derived in Oppenheim and Schafer [6]. This filter is of the form:

Where N1 is the order of the filter. The equation above with an order of N1 = 150 is what was used in figure 3.1 to replicate a similar figure in [4]. Later on in the paper, Arfib et al. provide some sample code for homomorphic cross-synthesis using a similar cepstrum weighting low-pass filter, however, it is of the form

Not only is there a change in magnitude but also the bounds changed slightly. This likely has a very small effect overall as the differences only affect a small number of samples. However, it was enough to cause confusion during implementation.
Arfib et al. also changed the order of the filter so that N1 = 30. No reason was given for this change, so it was also a source of confusion when implementing the topic. The order has an effect on the overall smoothness of the envelope. Consequently, it is possible that they used a low order filter to provide less resolution to the spectral envelopes. This will cause a sound that sounds more blended and less like the original modulator sound. In any case, the same order filters as the paper were used in this implementation.
Another implementation issue was that the MAX patch required a higher-order cepstrum weighting low-pass filter to produce the same sort of sound quality as the MATLAB script. Unfortunately, this was quite subjective and time requirements prevented quantifying this better. Therefore, the MAX patch uses a cepstrum weighting low-pass filter with an order of 100 to provide similar blending as the MATLAB script which uses an order of 30. This requirement could be a result of higher precision of floating point numbers in MATLAB compared to MAX. Exploration of these issues are left as future work for the author.
4.2 Advantages and Disadvantages
Cepstrum analysis, once understood, is a very simple way to estimate spectral envelopes. Since it does not deal with phases, it is a good tool to use if phase response is not a well understood concept. Furthermore, MAX is better suited to implementing cross-synthesis using cepstrum analysis than MATLAB. This is due to pfft~ handling the initial windowing, overlapping, and adding on its own, which greatly reduces the implementation effort and complexity. As well, MAX provides a GUI a priori, which provides a better user experience if someone else were required to use it. The bulk of it is also centralized in a single pfft~ sub-patch, so it can be easily integrated into any other patch that generates audio real time.
Disadvantages of cepstrum analysis are several FFTs and IFFTs are used on each frame, which can be computationally expensive. As well, cepstrum analysis essentially low-pass filters the spectrum to get the spectral envelope, which potentially averages out some of the spectral peaks in the spectrum [8]. Depending on the application, this can be undesirable. Having a good understanding of the input signal is required.
4.3 Future Work
There are many more applications with which to apply cepstrum analysis to digital audio. These include formant changing and pitch shifting, which were discussed in [4], but limitations on time prevented further exploring these subjects. Other papers in the literature explore voiced speech pitch determination [2] and blind deconvolution of old acoustic recordings [3], which would also be very interesting digital audio related applications to explore. Understanding why the MAX patch required a higher-order cepstrum low-pass weighting filter to produce similar quality blending as the MATLAB script would also be required.
Chapter 5
Conclusion
In conclusion, cepstrum analysis is a useful tool for audio processing. Cepstrum analysis allows you to estimate the spectral envelope of a signal and then use the envelope for more interesting applications, such as homomorphic cross-synthesis. The cepstrum is the IFFT of the logarithm of the magnitude of the spectrum. The real part of this gives a smoothed version of the spectral envelope of the original signal. This can be used in source filter separation that allows you to remove harmonic components of a signal from the spectral envelope. With this, homomorphic cross-synthesis can be used to reshape a source sound by imposing a different spectral envelope on it. Several MATLAB scripts and a MAX patch were written in order to illustrate these concepts. The MAX patch was better suited to implementing this topic due to advantages in MAX such as the pfft~ handling the initial windowing, overlapping, and adding on its own and the GUI element of MAX. Some issues that occurred during the implementation of this topic were with respect to the cepstrum weighting low-pass filter, both in the form and the order of the filter, because it was ill-defined in the literature. Advantages of cepstrum analysis are that it is quite easy to implement and calculate. Disadvantages are its computationally expense and that it can average out spectral peaks. With many applications to the world of digital audio, cepstrum analysis is a useful tool for us to use.
Bibliography
[1] Bruce P Bogert, Michael JR Healy, and John W Tukey. The quefrency alanysis of time series for echoes: Cepstrum, pseudo-autocovariance, cross-cepstrum and saphe cracking. In Proceedings of the symposium on time series analysis, volume 15, pages 209–243. chapter, 1963.
[2] A. Michael Noll. Cepstrum pitch determination. The journal of the acoustical society of America, 41(2):293–309, 1967.
[3] Thomas G Stockham, Thomas M Cannon, and Robert B Ingebretsen. Blind deconvolution through digital signal processing. Proceedings of the IEEE, 63(4):678–692, 1975.
[4] Daniel Arfib, Florian Keiler, and Udo Zölzer. DAFx: Digital Audio Effects, chapter Source-filter Processing, pages 299–372. John Wiley & Sons, Ltd, 2004.
[5] Alan V Oppenheim and Ronald W Schafer. From frequency to quefrency: a history of the cepstrum. IEEE signal processing Magazine, 21(5):95–106, 2004.
[6] Alan V Oppenheim and Ronald W Schafer. Digital Signal Processing. Prentice Hall, 1975.
[7] Julius O. Smith. Mus421/ee367b applications lecture 9b: Cross synthesis using cepstral smoothing or linear prediction for spectral envelopes. https://ccrma.stanford.edu/~jos/SpecEnv/SpecEnv.html. [Online; accessed 11-April-2017].
[8] Diemo Schwarz. Spectral envelopes in sound analysis and synthesis. PhD thesis, Universität Stuttgart, Fakultät Informatik, 1998.
